03 · Verification C3 · 2024-12-16 — free forecast vs radar truth, control vs radar-cycled WRF

Setup. DA cycling 14–17 Z (4 hourly 3D-Var cycles); free forecast starts at 17 Z (valid to 14 Z+1, 21 h) on d01→d02→d03 via ndown. Both branches share the same GFS lineage (fair baseline).

The event was a strong nocturnal convective line, 18–20 Z, near Arraial do Cabo (peak 64 dBZ). The d03 box (centred −22.40°, −41.75°) sits almost directly over the radar with 16 rain-gauge stations — good coverage for this scale.

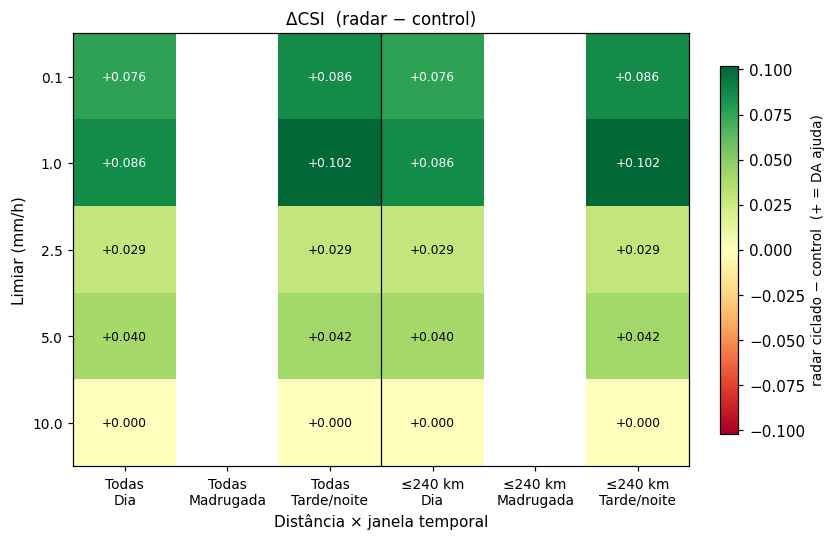
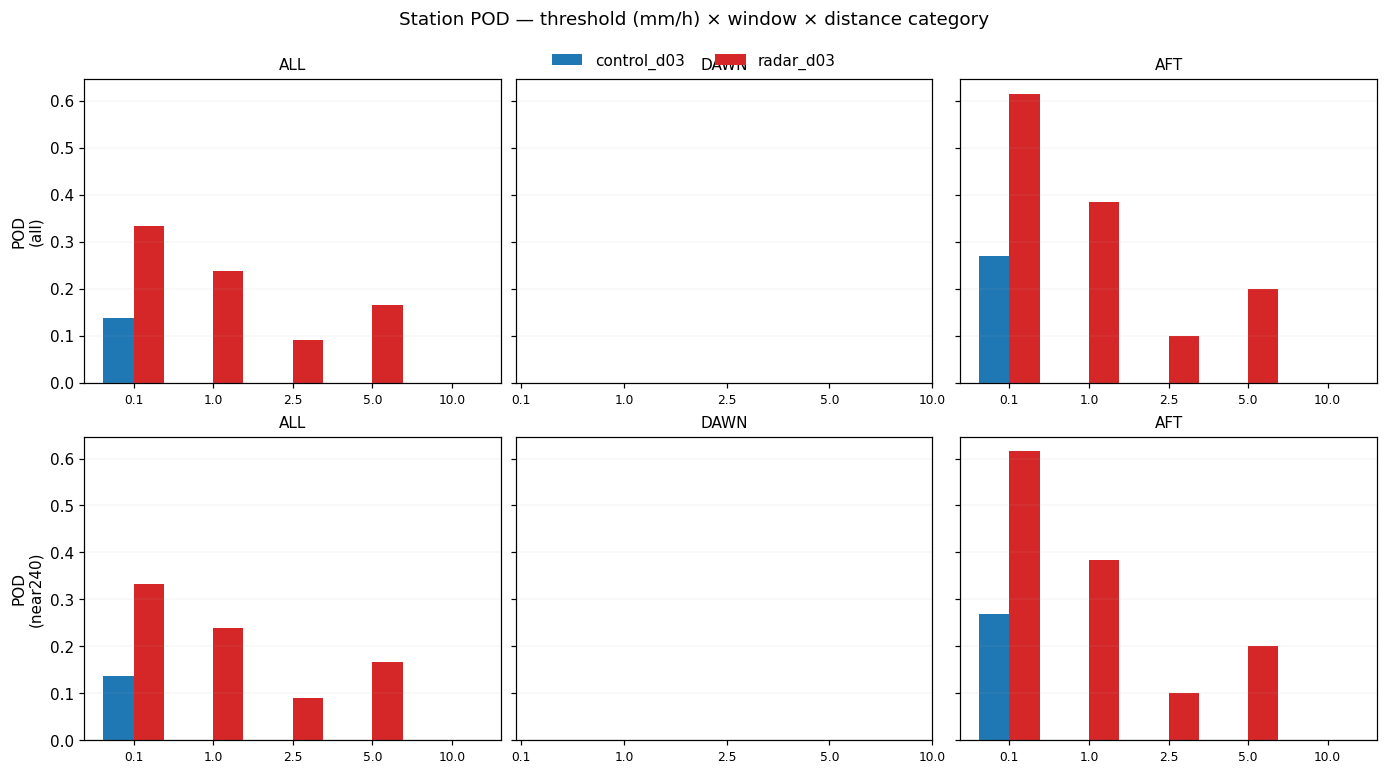
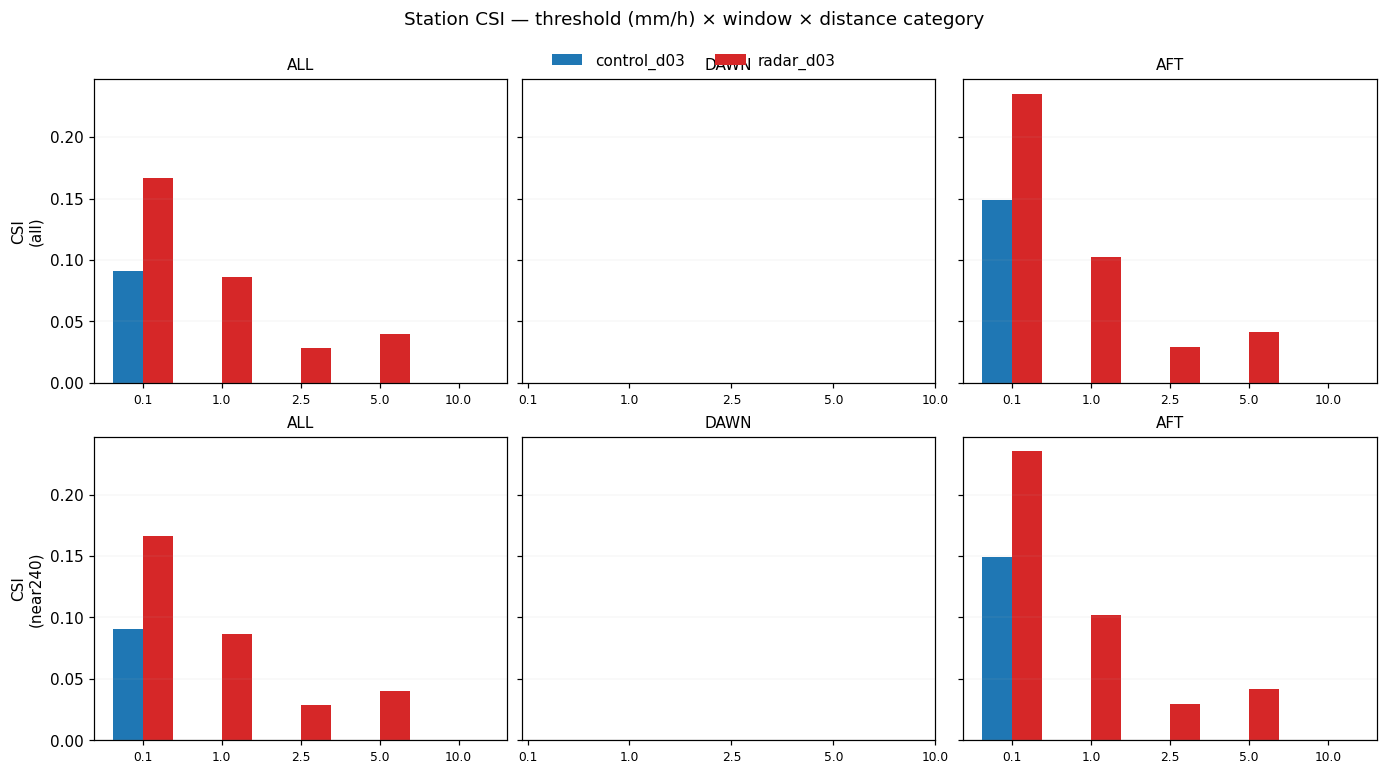
Key result: the control forecast had zero hits at all precipitation thresholds on d03. Radar DA recovered the event: POD ≥1 mm/h 0.00→0.385 (CSI 0→0.102). The model was blind; DA made it see.
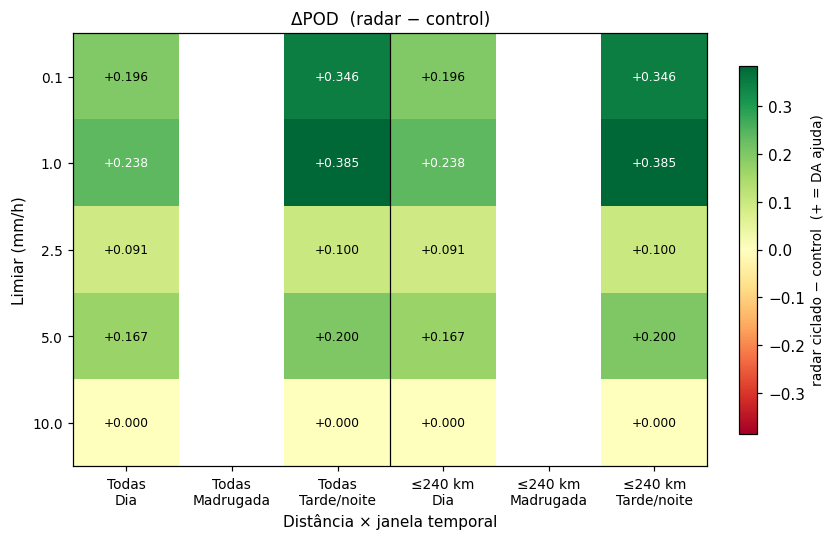
d03 POD heatmap — radar recovers missed event
d03 POD heatmap: control = 0 hits (left); radar DA recovers the event (POD 0→0.385 at ≥1 mm/h).
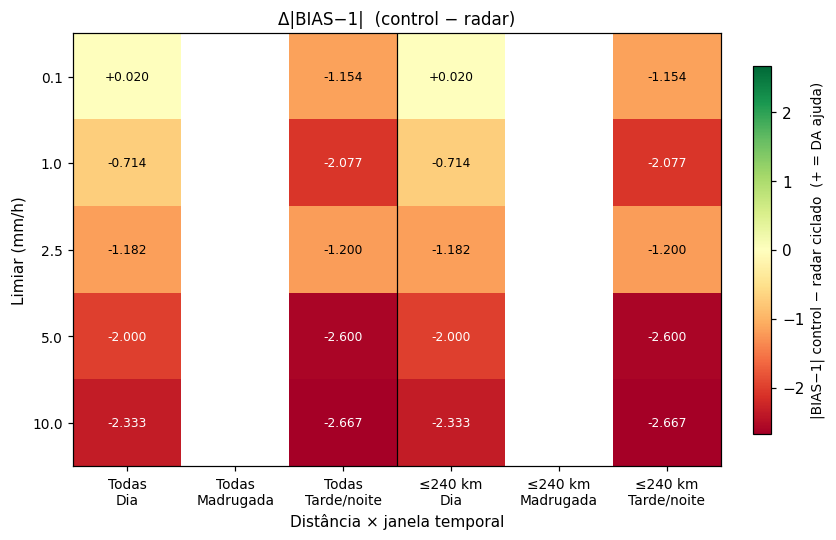
d03 headline: control missed the event entirely (0 hits at every threshold). Radar DA: POD ≥1 mm/h 0.00→0.385; ≥2.5 mm/h 0.00→0.100; ≥5 mm/h 0.00→0.200. BIAS ≈ 3 (over-forecast area, but hits where the control had nothing).
Radar blind spots. The truth field here is a single radar, and ~19% of d03 is blocked to it (W/NW behind the Serra do Mar, plus man-made dead sectors). See the beam-blockage study — found two ways, the radar's own persistently dead sectors and a terrain beam-blockage simulation — for where rain can fall unseen and why those gates are masked out of the assimilation and the verification truth field.

Interactive CREF viewer

Obs × control × radar DA — composite reflectivity, per domain, per hour

Open viewer

Tables (from MET verification CSVs)

Figures

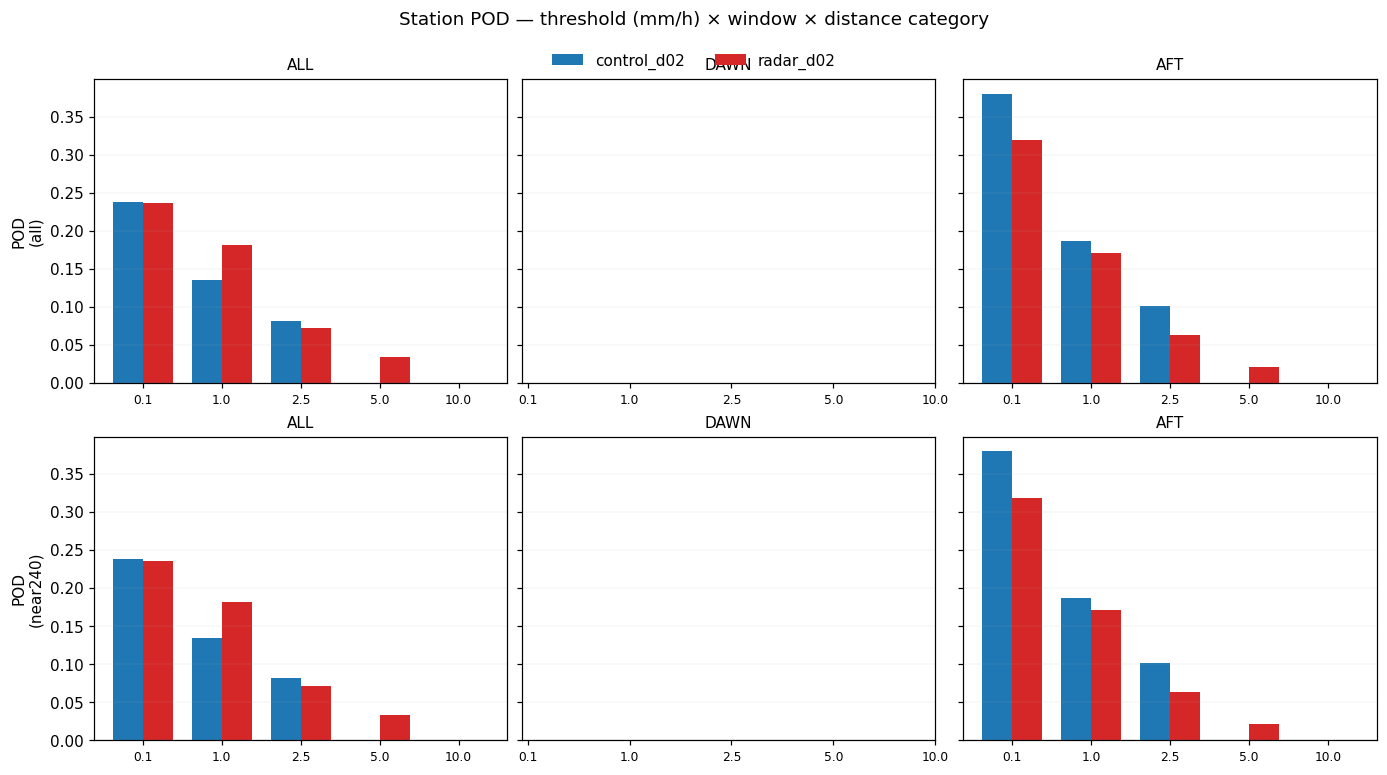
POD heatmap d02
Station

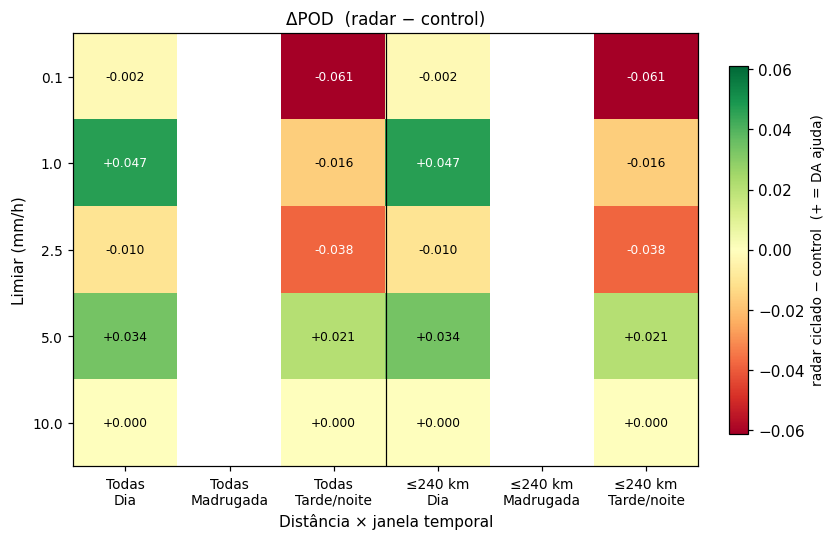
POD heatmap — d02

POD heatmap d03
Station

POD heatmap — d03

Control: 0. Radar: 0.385 at ≥1 mm/h.

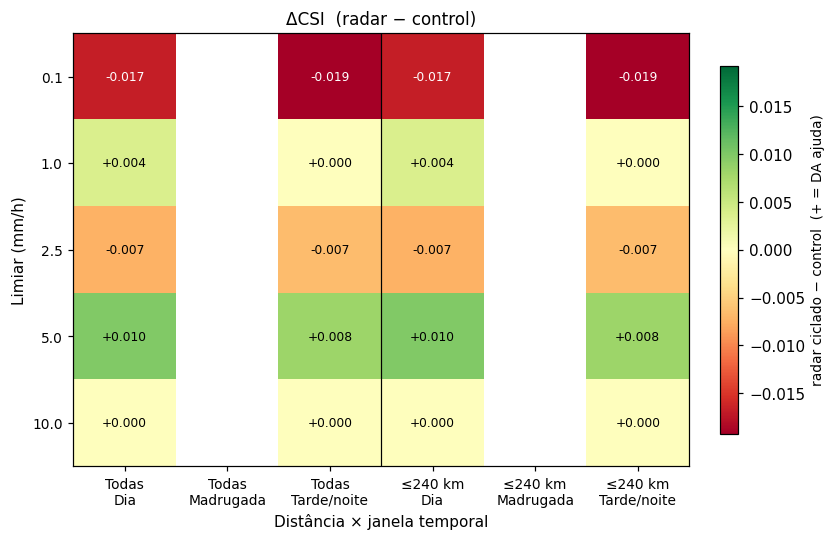
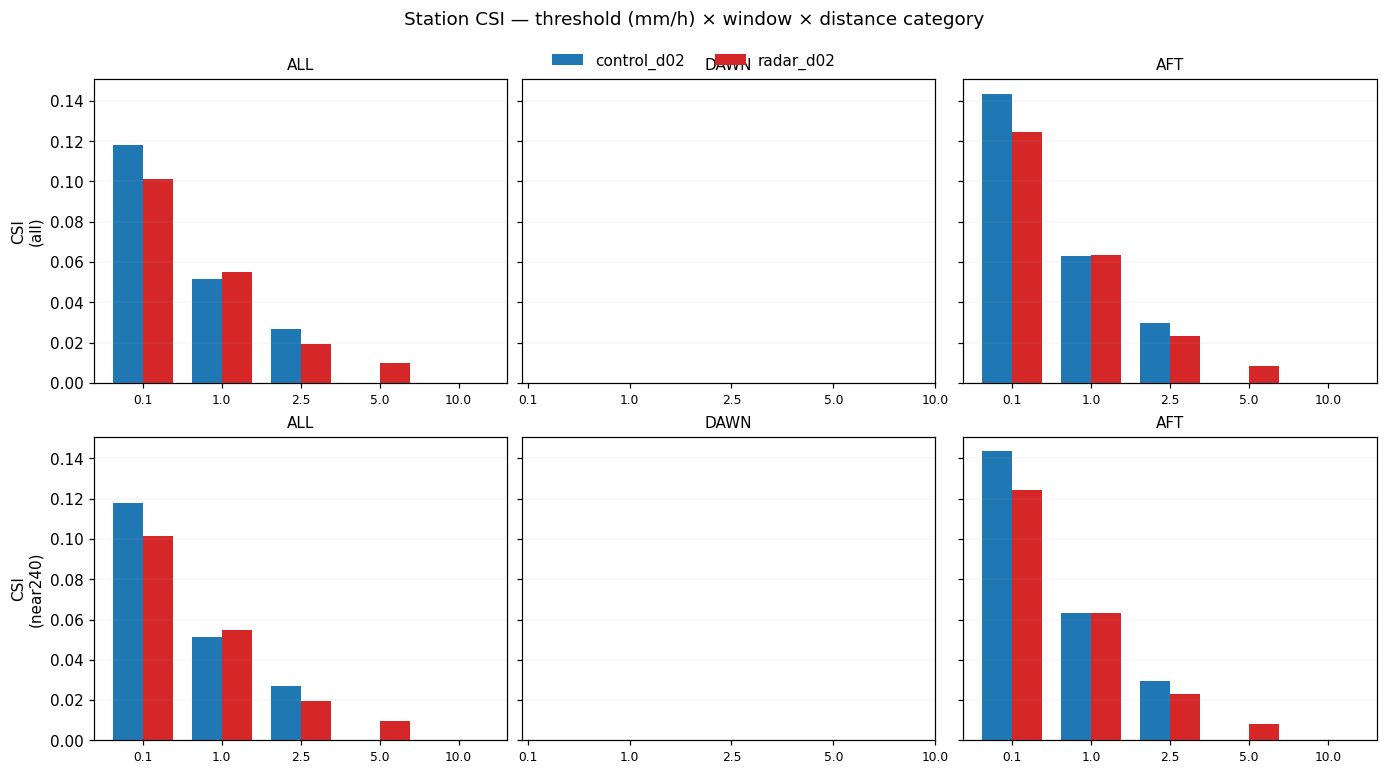
CSI heatmap d02
Station

CSI heatmap — d02

CSI heatmap d03
Station

CSI heatmap — d03

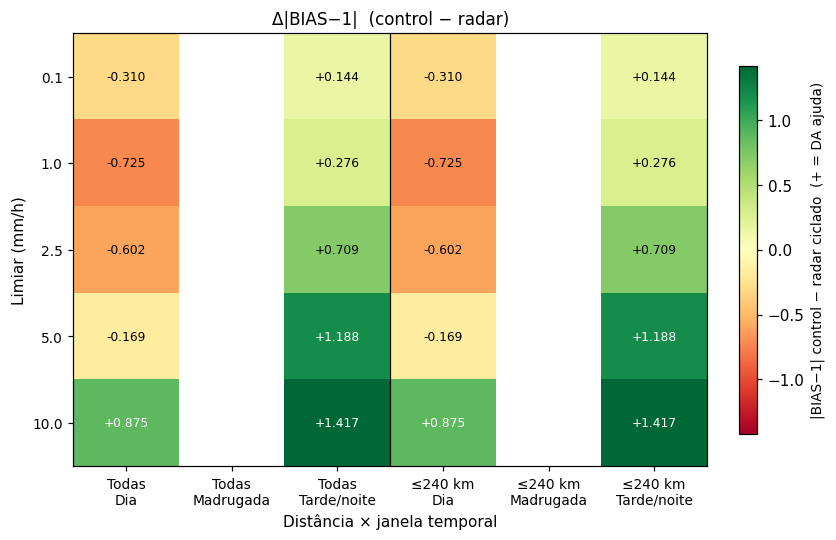
BIAS heatmap d02
Station

BIAS heatmap — d02

BIAS heatmap d03
Station

BIAS heatmap — d03

POD time-series d02
Station time-series

POD — d02

POD time-series d03
Station time-series

POD — d03

CSI d02
Station time-series

CSI — d02

CSI d03
Station time-series

CSI — d03

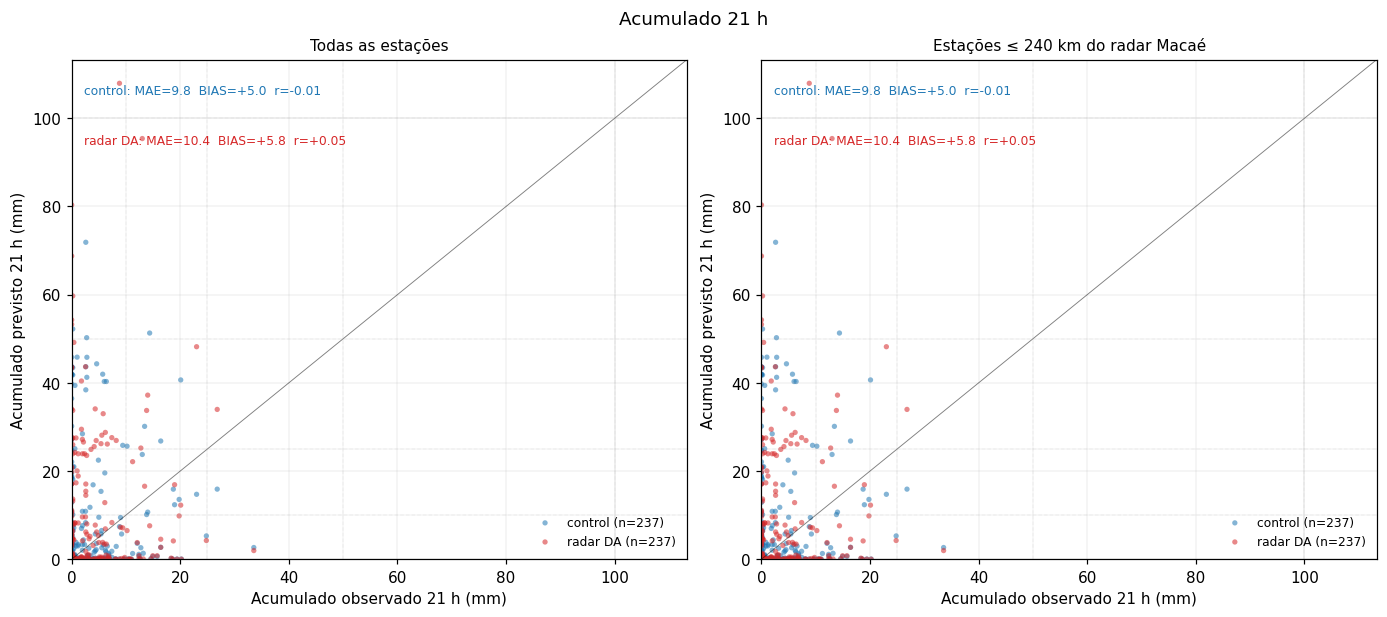
Scatter accum d02
Accumulation

Scatter — d02

MAE 9.8→10.4 mm (~neutral).

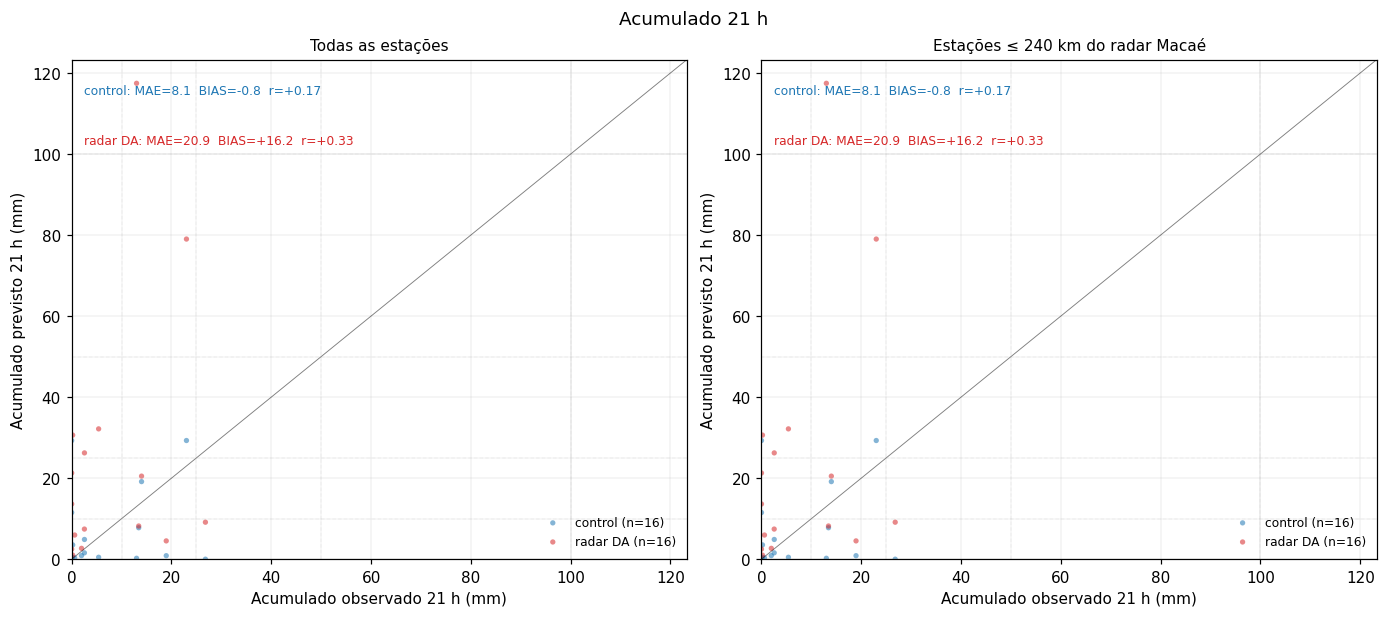
Scatter accum d03
Accumulation

Scatter — d03

MAE 8.1→20.9 mm; corr 0.17→0.33.

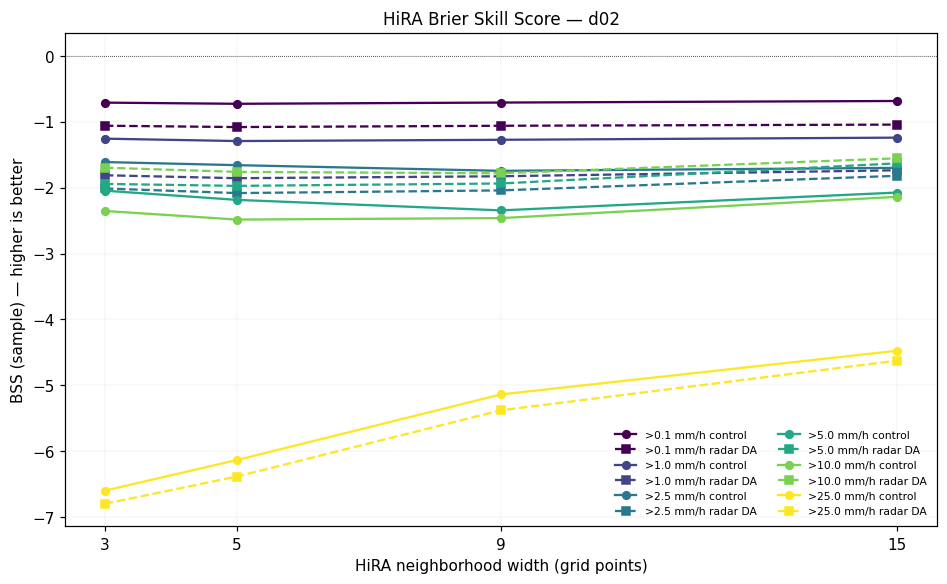
HiRA BSS d02
HiRA

BSS — d02

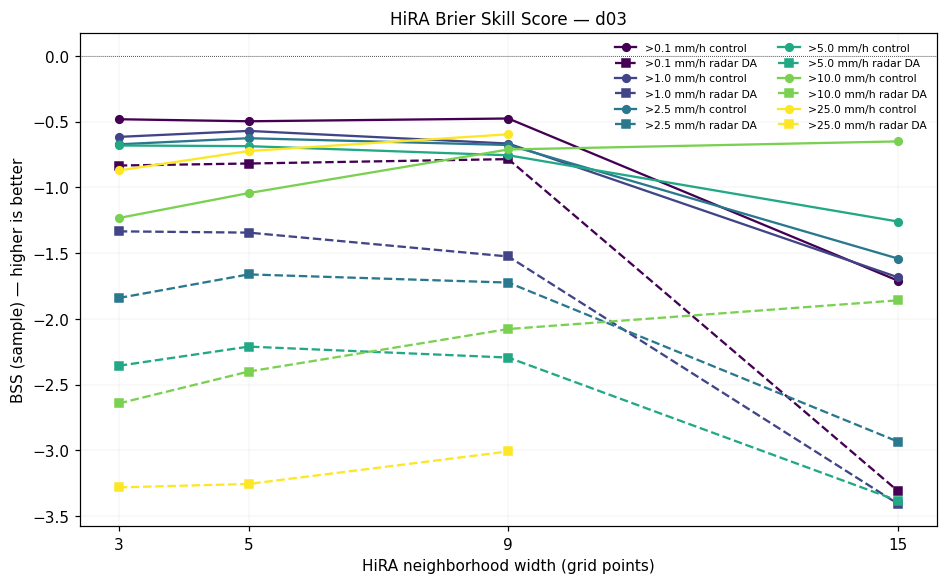
HiRA BSS d03
HiRA

BSS — d03

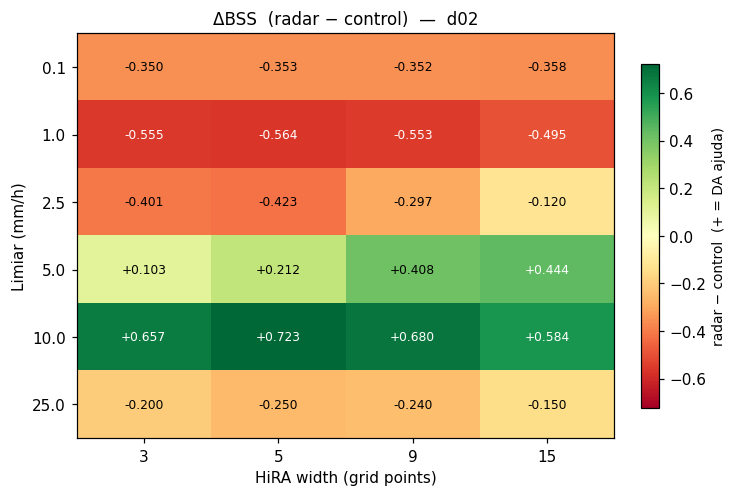
ΔBSS d02
HiRA

ΔBSS — d02

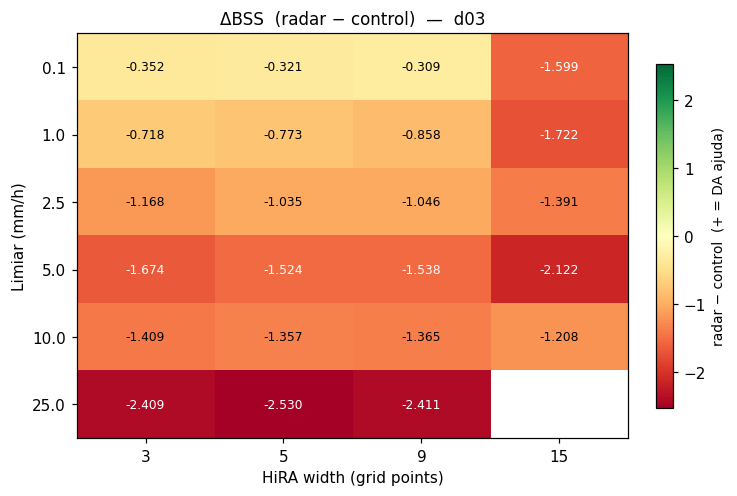
ΔBSS d03
HiRA

ΔBSS — d03

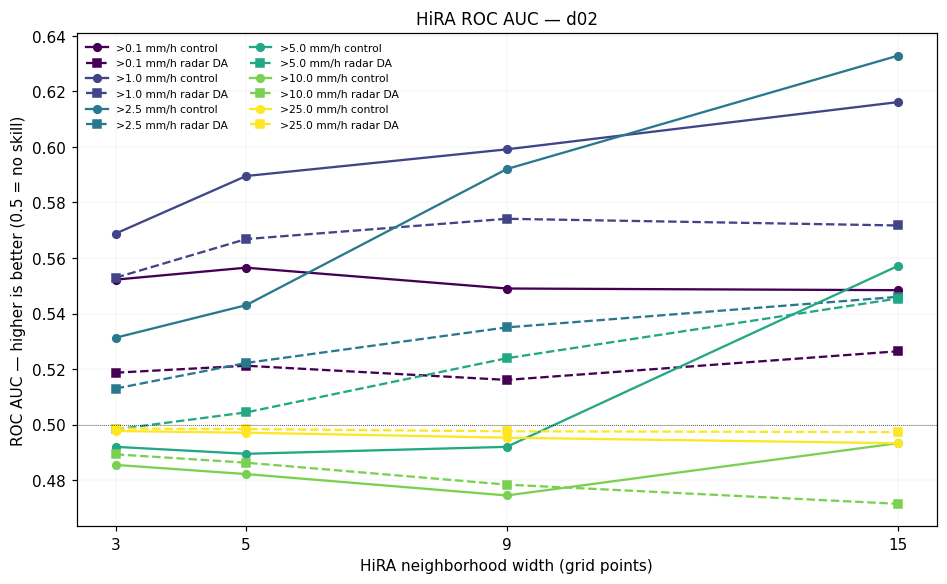
ROC AUC d02
HiRA

ROC AUC — d02

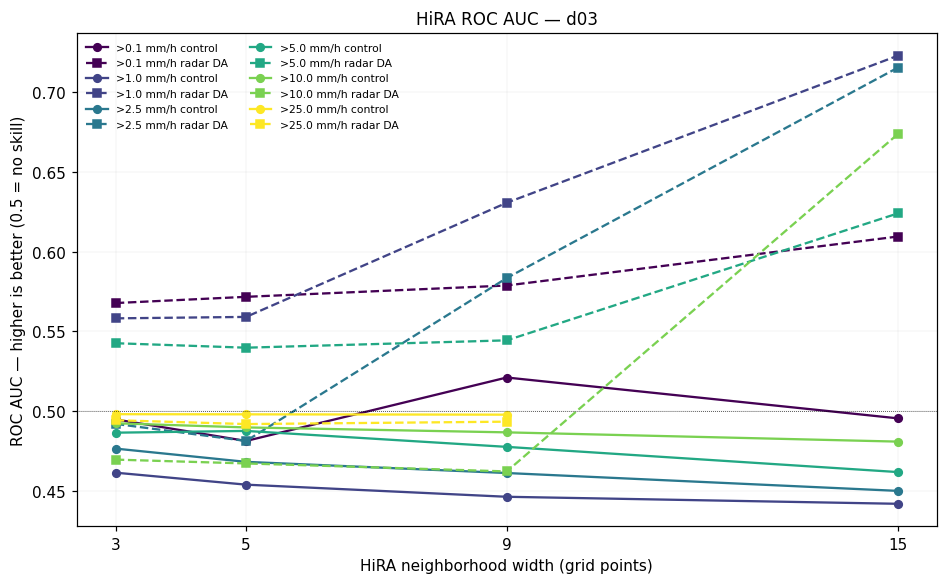
ROC AUC d03
HiRA

ROC AUC — d03

MODE centroid d02
MODE

Centroid distance — d02

92.7→112.5 km (worsens, 5 matched hrs).

MODE centroid d03
MODE

Centroid distance — d03

52.8→55.0 km (~neutral, 2 matched hrs).

MODE intensity d02
MODE

Intensity ratio — d02

MODE intensity d03
MODE

Intensity ratio — d03

MODE area ratio d02
MODE

Area ratio — d02

MODE area ratio d03
MODE

Area ratio — d03